Gathering feedback is often too complex. You get long-winded
answers. You may also get rants.
There's an interesting new online feedback option with Answer Garden.
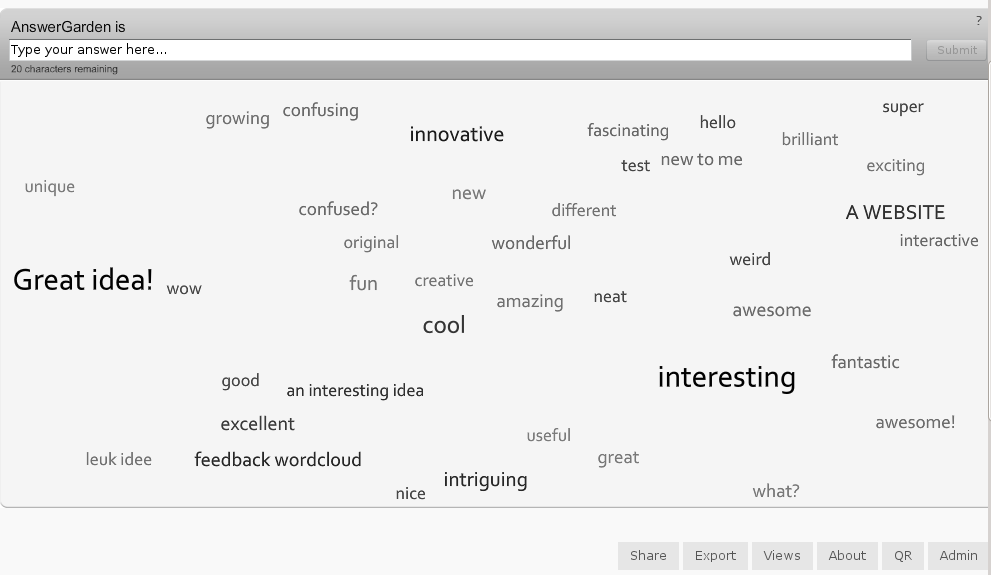
Answer Garden provides a very simple interface that encourages and limits to short answer responses. You only get 20 characters. Twitter's 140 characters allows seven times as much space. Still, twenty characters looks good when you see the output. It is in the form of a word cloud.
The live demo example looks like this:
(image captured May 25, 2012)
The demo is a live demo, of course, so the cloud will continue to develop over time.
It has been used as a tool for classroom brainstorming, and it looks like a way to develop consensus, too. You have the option to click a word somebody else has already submitted and submit, adding to the count for that choice.
You can limit submissions to a single time per day per computer, or leave it open, which looks like the way to go in a classroom feedback situation.
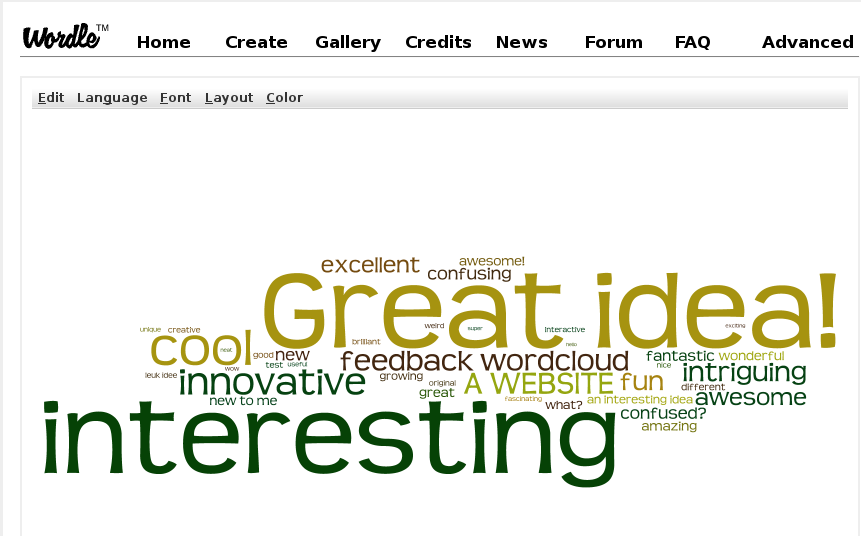
Although the developers, Creative Heroes, say they have not finished with this project, it offers many valuable features. You can transfer the data automatically to Wordle where you will get the chance to manipulate the word cloud for color, pattern, etc.

Let's look at a question of interest to members of
Natick FOSS. Give your feedback. Let other people know about it. Email,
tweet, Facebook... Let's find out what people think.
Software Freedom is...... at AnswerGarden.ch.
You can export the data, which reports the words and the number of times each has been submitted. With a bit of work, you can import the data into a spreadsheet to create a table and a graph.| Data imported to a spreadsheet |
Converting to a Graph |
||||||||||||||||||||||||||||||||||||||||||||||||||||||||||||||||||||||||||||||||
|
Data export is easy. Several export options are available. That means you can create a text file and then import it into a spreadsheet for further manipulation. At the left is the table of the demo data exported from the site on May 25, 2012. From that table in LibreOffice (other spreadsheets can do the same) it was quick work to make a chart (graph) from the data. Sometimes graphs are a quick way to see the power of number data. 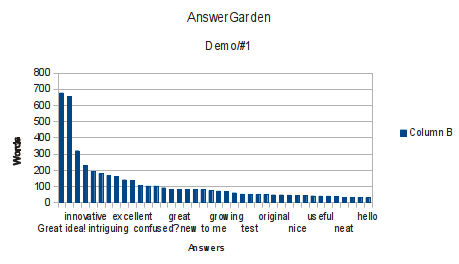 One observation from this data is that it illustrates the long tail distribution of the words used to describe something. While a typical multiple choice survey might produce a good comparison, this graph illustrates that an open ended question can give both the variation of the long tail and the relative consistency of the most popular cluster of answers. AnswerGarden does allow you to choose one of the other answers previously submitted. I don't know enough about experimental design to determine if that matters to the final spread of answers. The data is exported as a single line of text from: http://answergarden.ch/api/all/1 q=AnswerGarden is&a=Great idea!,interesting,cool,innovative,A WEBSITE,feedback wordcloud,intriguing,fun,awesome,excellent,confusing,new,confused?,fantastic,amazing,great,wonderful,awesome!,new to me,what?,an interesting idea,growing,different,good,test,creative,brilliant,original,leuk idee,interactive,nice,weird,fascinating,useful,unique,wow,super,neat,exciting,hello, &numbers=678,655,319,229,193,179,166,160,141,136,107,102,102,91,81,80,80,79,79,74,71,67,60,52,51,49,49,47,47,46,45,44,41,40,40,37,33,32,31,30, &returnedvalues=40&cloudid=1&unlimited=0&fullmode=0&status=ok It was necessary to paste the data into a simple text editor. I used Kate, the text editor of the KDE Software Compilation. Then I removed all but the words and the numbers and made them into two lines. In Kate, I removed all but the words and numbers organized in two lines. (I've shown only the first of each line to keep them from being too wide on this web view. Great idea!,interesting,cool,innovative,A WEBSITE,feedback,... 678,655,319,229,193,179,... Then I did an Insert > Sheet from file... Then Copy both lines from the sheet. Move to a blank space below the rows you've copied, and then Paste Special > Choose the Transpose option which will covert the horizontal data to vertical which is easier to visualize the numbers beside their words. You can create the graph from either the vertical or horizontal spreadsheet cell data. |